Rising Tide Of US Interest Payments
Filed in: Economy |Investment
03 June 2025
The Rising Tide of US Federal Interest Payments: A Historical Analysis and Future Concerns
Key Points Summary
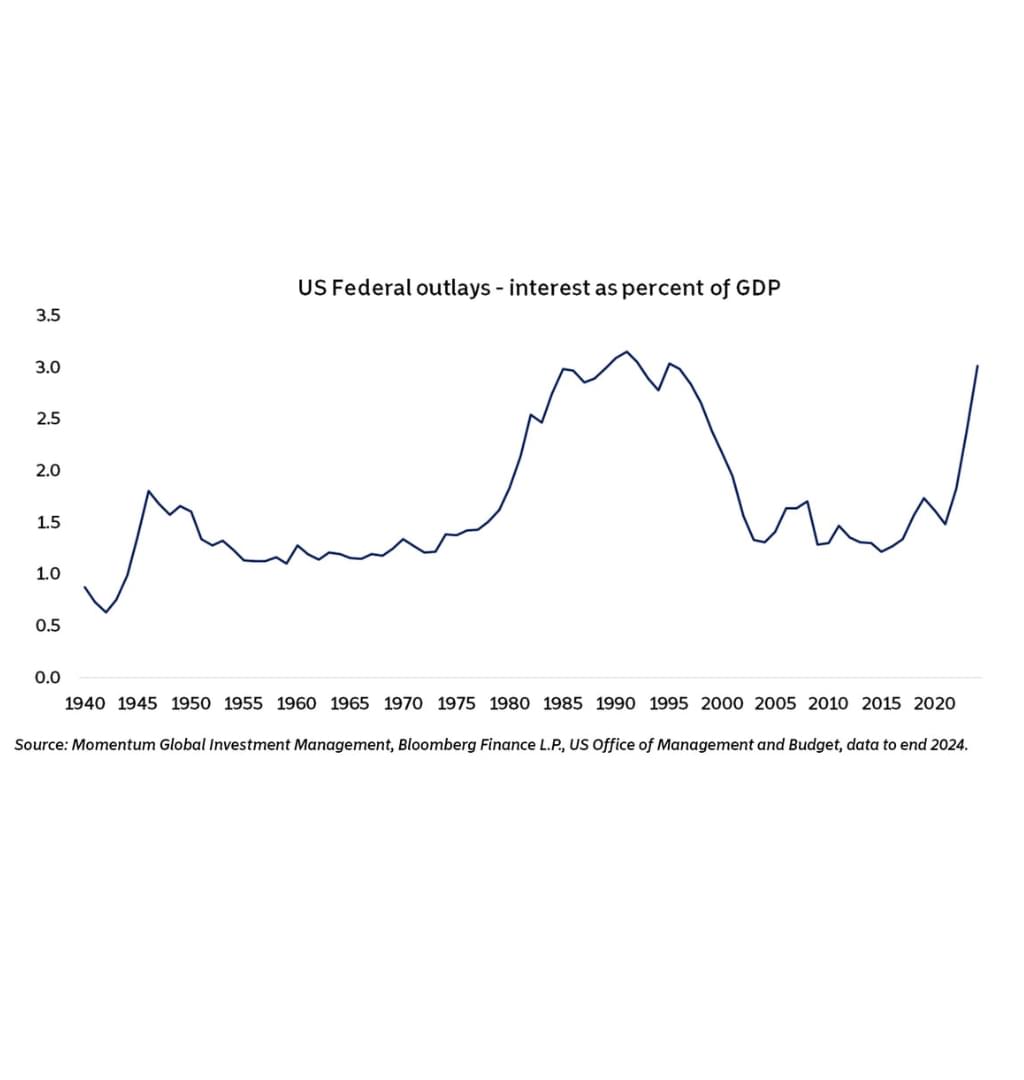
- Historic Crisis Unfolding - US federal interest payments are projected to hit 4% of GDP by 2035 - the highest level in 85 years of recorded history, surpassing even the 1991 peak during the era of 9.7% Treasury yields.
- Perfect Storm of Factors Unlike previous debt crises, today's burden stems from massive borrowing during the ultra-low rate era (2.5% average yields) now colliding with normalised interest rates, creating an unprecedented refinancing challenge.
- Imperial Decline Warning For the first time in a century, US debt service costs exceed defence spending - a historical pattern that has preceded the decline of great global powers, signalling potential threats to America's fiscal sustainability and world dominance.
The trajectory of US federal interest payments as a percentage of GDP tells a compelling and concerning story of fiscal evolution spanning more than eight decades. The chart reveals a dramatic transformation in America's debt servicing burden, one that carries profound implications for the nation's economic future and global standing.
Historical Context and Patterns
The data spanning from 1940 to 2024 reveals distinct phases in America's interest payment history. The early 1940s show remarkably low interest outlays, reflecting both the smaller federal debt burden and the artificially suppressed interest rates maintained during and immediately after World War II. This period of financial repression, where the Federal Reserve kept Treasury yields below inflation rates to help finance the war effort, resulted in interest payments that barely registered as a fraction of GDP.
The post-war era through the 1970s maintained relatively stable interest payments, hovering between 1% and 1.5% of GDP. This stability masked the underlying growth in federal debt, which was offset by the period's moderate interest rate environment and robust economic growth that expanded the GDP denominator.
The most striking feature of the historical data is the dramatic spike beginning in the late 1970s and reaching its zenith in the early 1990s. This period saw interest payments surge to over 3% of GDP, peaking around 1991. This surge coincided with the Federal Reserve's aggressive monetary tightening under Paul Volcker to combat the stagflation of the 1970s, followed by the continued high interest rate environment of the 1980s.
The 1980s-1990s Interest Rate Environment
The context surrounding the 1991 peak reveals the magnitude of today's challenge. During the decade leading to 1991, the average 10-year US Treasury yield reached an extraordinary 9.7%. This represented one of the most expensive periods for government borrowing in modern American history. The high yields reflected several factors: persistent inflation concerns, aggressive Federal Reserve policy to break the back of price instability, and strong economic growth that created competition for capital.
Despite these punishing borrowing costs, the US government's interest burden eventually declined after 1991. This decline was facilitated by several favorable developments: falling interest rates as inflation was tamed, strong economic growth during the 1990s expansion, and periodic budget surpluses that actually reduced the outstanding debt stock.
The Modern Low-Rate Era and Its Consequences
The period from the early 2000s through 2020 represents a fundamentally different monetary landscape. The decade ending in 2024 saw average 10-year Treasury yields of just 2.5%, less than one-quarter the level of the 1980s. This era of "tremendous lender generosity" was characterised by the Federal Reserve's response to successive crises: the dot-com bubble, the 2008 financial crisis, and ultimately the COVID-19 pandemic.
Zero interest rate policies (ZIRP) and quantitative easing programs created an environment where the US government could borrow at historically unprecedented low rates. This period saw the federal debt expand dramatically - from roughly $5 trillion in 2000 to over $27 trillion by 2020 - yet interest payments remained manageable due to the suppressed borrowing costs.
The Current Inflection Point
The sharp upturn visible in the chart's final years represents a dangerous confluence of factors. The "unsustainable trajectory of debt issuance" combined with the "normalisation of interest rates" has created a perfect storm for federal finances. As the Federal Reserve has raised rates to combat post-pandemic inflation, the government faces the dual challenge of higher borrowing costs on new debt and the refinancing of existing debt at substantially higher rates.
The refinancing challenge is particularly acute. A significant portion of the federal debt is scheduled to mature and require refinancing over the next five years. Back-of-the-envelope calculations suggest that this refinancing alone will add approximately 0.5% of GDP to annual interest payments, representing tens of billions of dollars in additional fiscal burden.
Unprecedented Territory Ahead
The forecast trajectory toward 4% of GDP by 2035 would represent uncharted territory in modern American fiscal history. Unlike the 1991 peak, which occurred during a period when subsequent rate declines provided relief, the current situation offers no such easy escape. The structural factors driving interest rates--including persistent inflation pressures, massive global debt issuance, and deglobalisation trends--suggest that the low-rate environment of the 2010s was an aberration rather than a new normal.
Credit Rating Implications and Market Discipline
The mounting concern over America's debt trajectory has already manifested in credit rating actions. Moody's recent downgrade of the US below AAA status represents a watershed moment, as the final major rating agency to acknowledge the deteriorating fiscal picture. This downgrade reflects not just the mathematical reality of rising debt-to-GDP ratios, but also concerns about the political system's ability to address the underlying structural imbalances.
The reference to "bond vigilantes" returning carries particular historical significance. During the 1990s, bond market pressure helped discipline fiscal policy, contributing to the budget surpluses of the late Clinton era. However, the current political environment appears less responsive to market signals, with both major political parties having demonstrated limited appetite for the difficult choices required to restore fiscal balance.
Historical Parallels and Imperial Decline
Perhaps most sobering is the historical analysis suggesting that when debt service costs exceed defence spending - as occurred in 2024 for the first time in a century - this pattern has historically preceded the decline of great powers. This metric captures something fundamental about national priorities and fiscal capacity.
When a nation spends more servicing its debts than defending its interests, it signals a potentially irreversible shift in national capabilities and global influence.
The Path Forward
The trajectory shown in this chart represents more than an accounting exercise--it reflects fundamental questions about America's fiscal sustainability and global leadership. Unlike previous periods of high interest burdens, the current situation combines unprecedented debt levels with limited policy flexibility and structural demographic challenges that will only intensify fiscal pressures.
The rising tide of interest payments threatens to crowd out other government priorities, from infrastructure investment to social programs to defence spending. Without significant policy changes, this trend could fundamentally alter the role of the federal government and America's position in the global economy. The historical record suggests that such fiscal transitions rarely end well for dominant powers, making the current trajectory not just economically concerning, but strategically perilous.